
What is the 3-Statement Model?
In the high-stakes world of investment banking, where multimillion-dollar deals hinge on precise forecasts and razor-sharp analysis, one tool stands above the rest as the foundation of everything: the 3-Statement Model. Whether you're an analyst cranking out a pitchbook at 2 a.m. or an associate modeling an LBO for a private equity client, this integrated Excel framework is your daily bread. It links a company's income statement, balance sheet, and cash flow statement into one dynamic, forward-looking spreadsheet. Changes in revenue growth, capital expenditures, or debt levels ripple automatically across all three statements, revealing exactly how operational, investing, and financing decisions interact.
Far more than a simple spreadsheet exercise, the 3-statement model transforms raw historical data into credible projections—typically over a five-year forecast horizon. It answers critical questions: Can this company generate enough cash to service new debt? How will a margin expansion affect its balance sheet? Is the projected free cash flow realistic for a discounted cash flow (DCF) valuation? For aspiring investment bankers, mastering it isn't optional—it's table stakes. Recruiters test it in modeling interviews, and once you're on the desk, you'll build variations of it daily. In this article, we'll break down exactly what the 3-statement model is, why it matters for your IB career, how to build one from scratch, and pro tips to stand out.
The Three Core Financial Statements
At its core, the 3-statement model rests on the three pillars of financial reporting, each telling a different part of the company's story.The income statement (also called the profit-and-loss or P&L) measures performance over a period—quarterly or annually. It starts with revenue, subtracts cost of goods sold to get gross profit, then layers on operating expenses, interest, taxes, and other items to arrive at net income. The formula is straightforward:Net Income = Revenue − Expenses − Taxes.This statement reveals profitability and operational efficiency but ignores timing of cash movements.
The balance sheet provides a snapshot of financial position at a single point in time. It follows the fundamental accounting identity:Assets = Liabilities + Shareholders' Equity.Assets include cash, accounts receivable, inventory, and property, plant & equipment (PP&E). Liabilities cover debt, accounts payable, and accrued expenses. Equity includes retained earnings and common stock. The balance sheet shows what the company owns, owes, and the net worth attributable to owners.
The cash flow statement bridges the gap between accrual accounting (income statement) and actual cash. It breaks cash movements into three sections: operating activities (core business cash generation), investing activities (Capex and acquisitions), and financing activities (debt raises, repayments, dividends, and equity issuances). The bottom line is the net change in cash, which must reconcile to the cash balance on the balance sheet.
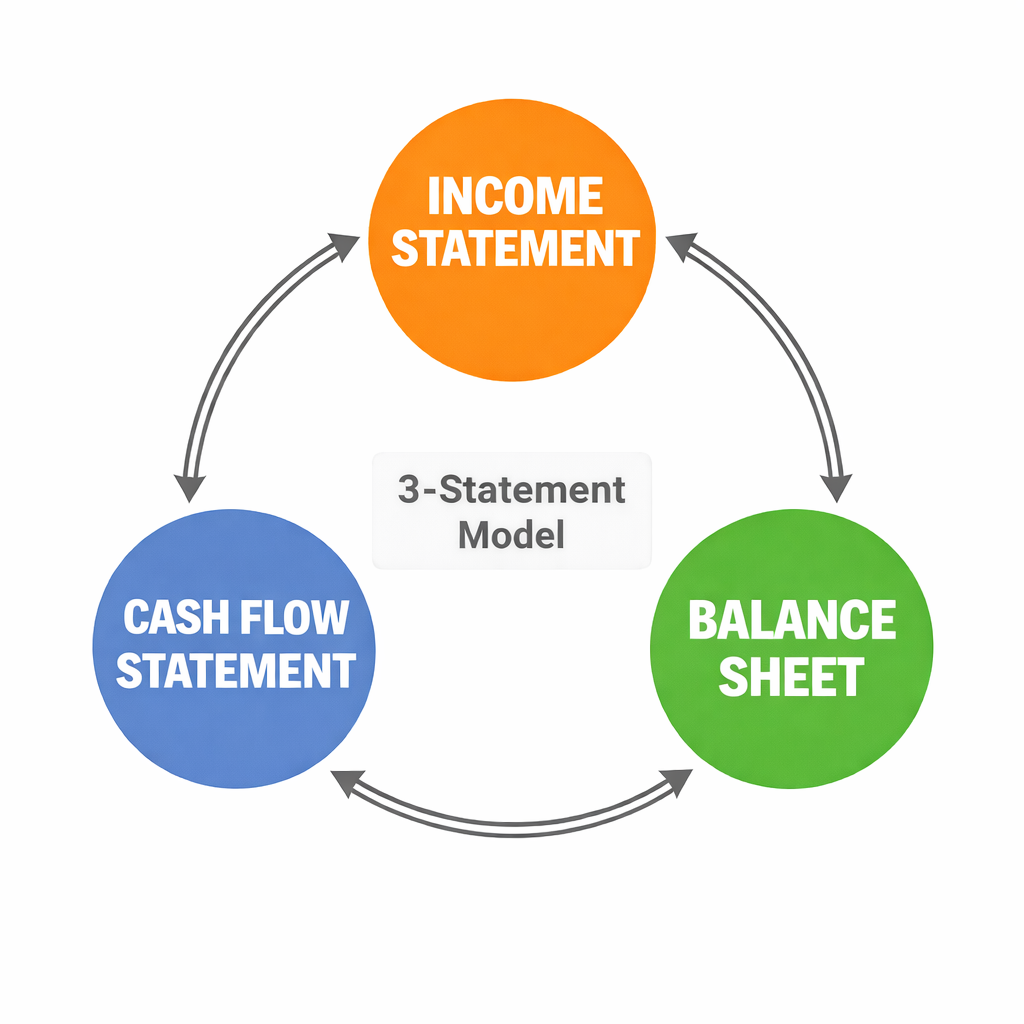
Alone, each statement is useful. Together in a 3-statement model, they become powerful because they are integrated. Net income flows into retained earnings. Depreciation (a non-cash expense on the income statement) is added back in cash from operations. Capital expenditures reduce cash from investing while increasing PP&E on the balance sheet. This dynamic linkage ensures internal consistency—your model literally won't balance if your assumptions are off.
The Magic of Integration: Why Linkages Matter
The true power of the 3-statement model lies in these interconnections, which act as a built-in error check. Here's how the statements talk to each other:- Net income from the income statement feeds directly into retained earnings on the balance sheet (after dividends).
- Depreciation and amortization reduce net income but are added back in the cash flow statement's operating section; they also reduce net PP&E on the balance sheet.
- Changes in working capital (e.g., rising accounts receivable) appear as a use of cash in operating cash flow and adjust current assets/liabilities on the balance sheet.
- Capital expenditures hit investing cash flow as an outflow and increase gross PP&E.
- Debt and equity transactions (interest expense, principal repayments, dividends) flow through financing cash flow and update the balance sheet's liabilities and equity.
- Interest expense (calculated from average debt balances) loops back to the income statement—often creating a circular reference in Excel that requires careful handling with a circularity switch.
Step-by-Step: Building a 3-Statement Model
Building your first model from a blank Excel sheet is a rite of passage for IB analysts. Here's a professional, battle-tested process (typically completed in 60–90 minutes during interviews):- Set up the structure and input historicals. Create separate tabs or sections for assumptions, income statement, balance sheet, cash flow statement, and supporting schedules (PP&E, working capital, debt). Paste 3–5 years of historical data from 10-Ks or company filings. Color-code inputs blue, formulas black. Calculate key historical ratios: revenue growth, gross margin, SG&A as % of revenue, effective tax rate, days sales outstanding (DSO), Capex as % of revenue, etc.
- Define forward assumptions. Base these on management guidance, industry benchmarks, or case study prompts. Common drivers include revenue CAGR, margin expansion, Capex policy, and working capital turns. Keep assumptions in one clean input block for easy scenario toggling.
- Forecast the income statement. Project revenue using growth rates. Layer on cost of goods sold and operating expenses using margin assumptions. Calculate EBIT, subtract interest (from debt schedule), apply taxes, and arrive at net income. This becomes the model's engine.
- Build supporting schedules.
- PP&E schedule: Beginning balance + Capex − Depreciation = Ending balance.
- Working capital schedule: Project receivables, inventory, and payables based on days ratios applied to revenue or COGS.
- Debt schedule: Track revolver, term loans, and interest expense (often using average balances to handle circularity).
- Forecast the balance sheet. Start with the prior period's ending balances. Link retained earnings (prior + net income − dividends). Roll forward PP&E and working capital from schedules. Project other assets/liabilities. The cash line becomes a "plug"—the amount needed to make the balance sheet balance.
- Complete the cash flow statement. Start with net income, add back non-cash items (D&A), adjust for changes in working capital, subtract Capex, add net borrowing/equity issuance, and calculate net change in cash. This change must exactly match the movement in the balance sheet's cash line.
- Balance the model and add checks. Insert a "balance check" row (assets − liabilities − equity = 0). Use Excel's circularity switch (enable iterative calculations) for interest. Run sensitivity tables and charts to visualize outputs like free cash flow, leverage ratios, and return on equity.
Real-World Applications in Investment Banking
Investment bankers live in 3-statement models. They form the base for DCF valuations (free cash flow to firm comes straight from the model), merger models (pro forma integration of buyer and target), LBOs (debt paydown and returns analysis), and equity research comps. In pitchbooks, they demonstrate how a potential acquisition will be accretive or how a recapitalization affects credit metrics. For clients, the model quantifies strategic options—should we expand Capex or return capital via buybacks?Mastering this skill signals to managing directors that you can think like an owner: understanding not just "what" happened but "why" and "what if."
Common Pitfalls and Pro Tips for Aspiring Bankers
New analysts often stumble on circular references, mismatched timing (quarterly vs. annual), or forgetting to link dividends. Avoid these by building clean, modular models with clear labels and error checks. Always foot-tie historicals first. Practice with real 10-Ks—download Otis Worldwide or a similar mid-cap filer and replicate their statements.Pro tips: Use keyboard shortcuts religiously (Ctrl + R for fill right, Alt + E + S + F for paste formulas). Follow best practices from Wall Street Prep or Corporate Finance Institute templates. Time yourself on practice cases. In interviews, narrate your logic: "I'm projecting DSO flat at 45 days because historical trends show stability." And remember—accuracy trumps complexity. A simple, error-free model beats a flashy one with broken links.
Conclusion
The 3-statement model is more than Excel wizardry—it's the language of finance. It equips you to forecast with confidence, stress-test assumptions, and communicate insights that move deals forward. For anyone eyeing an investment banking career, fluency here separates candidates from hires. Start building one today. Your future desk (and bonus) will thank you.


What is the 3-Statement Model?
In the high-stakes world of investment banking, where multimillion-dollar deals hinge on precise forecasts and razor-sharp analysis, one tool stands above the rest as the foundation of everything: the 3-Statement Model. Whether you're an analyst cranking out a pitchbook at 2 a.m. or an associate modeling an LBO for a private equity client, this integrated Excel framework is your daily bread. It links a company's income statement, balance sheet, and cash flow statement into one dynamic, forward-looking spreadsheet. Changes in revenue growth, capital expenditures, or debt levels ripple automatically across all three statements, revealing exactly how operational, investing, and financing decisions interact.
Far more than a simple spreadsheet exercise, the 3-statement model transforms raw historical data into credible projections—typically over a five-year forecast horizon. It answers critical questions: Can this company generate enough cash to service new debt? How will a margin expansion affect its balance sheet? Is the projected free cash flow realistic for a discounted cash flow (DCF) valuation? For aspiring investment bankers, mastering it isn't optional—it's table stakes. Recruiters test it in modeling interviews, and once you're on the desk, you'll build variations of it daily. In this article, we'll break down exactly what the 3-statement model is, why it matters for your IB career, how to build one from scratch, and pro tips to stand out.
The Three Core Financial Statements
At its core, the 3-statement model rests on the three pillars of financial reporting, each telling a different part of the company's story.The income statement (also called the profit-and-loss or P&L) measures performance over a period—quarterly or annually. It starts with revenue, subtracts cost of goods sold to get gross profit, then layers on operating expenses, interest, taxes, and other items to arrive at net income. The formula is straightforward:Net Income = Revenue − Expenses − Taxes.This statement reveals profitability and operational efficiency but ignores timing of cash movements.
The balance sheet provides a snapshot of financial position at a single point in time. It follows the fundamental accounting identity:Assets = Liabilities + Shareholders' Equity.Assets include cash, accounts receivable, inventory, and property, plant & equipment (PP&E). Liabilities cover debt, accounts payable, and accrued expenses. Equity includes retained earnings and common stock. The balance sheet shows what the company owns, owes, and the net worth attributable to owners.
The cash flow statement bridges the gap between accrual accounting (income statement) and actual cash. It breaks cash movements into three sections: operating activities (core business cash generation), investing activities (Capex and acquisitions), and financing activities (debt raises, repayments, dividends, and equity issuances). The bottom line is the net change in cash, which must reconcile to the cash balance on the balance sheet.
Alone, each statement is useful. Together in a 3-statement model, they become powerful because they are integrated. Net income flows into retained earnings. Depreciation (a non-cash expense on the income statement) is added back in cash from operations. Capital expenditures reduce cash from investing while increasing PP&E on the balance sheet. This dynamic linkage ensures internal consistency—your model literally won't balance if your assumptions are off.
The Magic of Integration: Why Linkages Matter
The true power of the 3-statement model lies in these interconnections, which act as a built-in error check. Here's how the statements talk to each other:- Net income from the income statement feeds directly into retained earnings on the balance sheet (after dividends).
- Depreciation and amortization reduce net income but are added back in the cash flow statement's operating section; they also reduce net PP&E on the balance sheet.
- Changes in working capital (e.g., rising accounts receivable) appear as a use of cash in operating cash flow and adjust current assets/liabilities on the balance sheet.
- Capital expenditures hit investing cash flow as an outflow and increase gross PP&E.
- Debt and equity transactions (interest expense, principal repayments, dividends) flow through financing cash flow and update the balance sheet's liabilities and equity.
- Interest expense (calculated from average debt balances) loops back to the income statement—often creating a circular reference in Excel that requires careful handling with a circularity switch.
Step-by-Step: Building a 3-Statement Model
Building your first model from a blank Excel sheet is a rite of passage for IB analysts. Here's a professional, battle-tested process (typically completed in 60–90 minutes during interviews):- Set up the structure and input historicals. Create separate tabs or sections for assumptions, income statement, balance sheet, cash flow statement, and supporting schedules (PP&E, working capital, debt). Paste 3–5 years of historical data from 10-Ks or company filings. Color-code inputs blue, formulas black. Calculate key historical ratios: revenue growth, gross margin, SG&A as % of revenue, effective tax rate, days sales outstanding (DSO), Capex as % of revenue, etc.
- Define forward assumptions. Base these on management guidance, industry benchmarks, or case study prompts. Common drivers include revenue CAGR, margin expansion, Capex policy, and working capital turns. Keep assumptions in one clean input block for easy scenario toggling.
- Forecast the income statement. Project revenue using growth rates. Layer on cost of goods sold and operating expenses using margin assumptions. Calculate EBIT, subtract interest (from debt schedule), apply taxes, and arrive at net income. This becomes the model's engine.
- Build supporting schedules.
- PP&E schedule: Beginning balance + Capex − Depreciation = Ending balance.
- Working capital schedule: Project receivables, inventory, and payables based on days ratios applied to revenue or COGS.
- Debt schedule: Track revolver, term loans, and interest expense (often using average balances to handle circularity).
- Forecast the balance sheet. Start with the prior period's ending balances. Link retained earnings (prior + net income − dividends). Roll forward PP&E and working capital from schedules. Project other assets/liabilities. The cash line becomes a "plug"—the amount needed to make the balance sheet balance.
- Complete the cash flow statement. Start with net income, add back non-cash items (D&A), adjust for changes in working capital, subtract Capex, add net borrowing/equity issuance, and calculate net change in cash. This change must exactly match the movement in the balance sheet's cash line.
- Balance the model and add checks. Insert a "balance check" row (assets − liabilities − equity = 0). Use Excel's circularity switch (enable iterative calculations) for interest. Run sensitivity tables and charts to visualize outputs like free cash flow, leverage ratios, and return on equity.
Real-World Applications in Investment Banking
Investment bankers live in 3-statement models. They form the base for DCF valuations (free cash flow to firm comes straight from the model), merger models (pro forma integration of buyer and target), LBOs (debt paydown and returns analysis), and equity research comps. In pitchbooks, they demonstrate how a potential acquisition will be accretive or how a recapitalization affects credit metrics. For clients, the model quantifies strategic options—should we expand Capex or return capital via buybacks?Mastering this skill signals to managing directors that you can think like an owner: understanding not just "what" happened but "why" and "what if."
Common Pitfalls and Pro Tips for Aspiring Bankers
New analysts often stumble on circular references, mismatched timing (quarterly vs. annual), or forgetting to link dividends. Avoid these by building clean, modular models with clear labels and error checks. Always foot-tie historicals first. Practice with real 10-Ks—download Otis Worldwide or a similar mid-cap filer and replicate their statements.Pro tips: Use keyboard shortcuts religiously (Ctrl + R for fill right, Alt + E + S + F for paste formulas). Follow best practices from Wall Street Prep or Corporate Finance Institute templates. Time yourself on practice cases. In interviews, narrate your logic: "I'm projecting DSO flat at 45 days because historical trends show stability." And remember—accuracy trumps complexity. A simple, error-free model beats a flashy one with broken links.
Conclusion
The 3-statement model is more than Excel wizardry—it's the language of finance. It equips you to forecast with confidence, stress-test assumptions, and communicate insights that move deals forward. For anyone eyeing an investment banking career, fluency here separates candidates from hires. Start building one today. Your future desk (and bonus) will thank you.